
Metrics from various analytics platforms show that large-scale investors are increasing their investment with digital assets. However, BTC is yet to break its $50K key resistance. Hence, a break may lead to solid bullish momentum. Here’s a quick analysis of some of the digital assets’ chart performance.
BTC/USDT
Short-term bears created a selling pressure on August 26 when the king coin briefly attained the $50K price. Hence, it had to retreat beneath the newly created wedge pattern. However, short-term traders couldn’t take advantage of BTC action to cause a further downtrend beneath the moving averages.
Instead, the long-term holders have regained control to push it into the wedge. If the king coin can maintain this rally, moving towards the top of the key resistance (around $50.5K) is possible. Once that action becomes a reality, a new strong momentum should be expected.
However, this movement could be stalled by the short-term traders looking to take profits. A price correction during this period might result in a bounce around the wedge. However, once the pair breaks out of that bounce, its next resistance will be the $61K level.
ETH/USDT
In the last couple of days, the second-largest cryptocurrency keeps bouncing around the $3,300 range. Technical indicators suggest that supply and demand are almost equal. ETH has now broken out of the 20-day EMA, and bulls are making their entry to prevent further selling pressure.
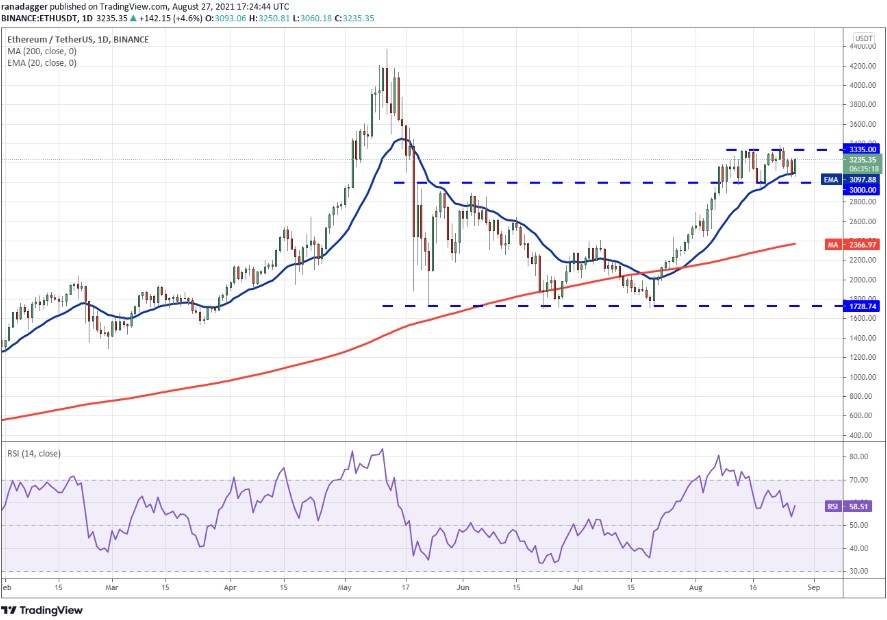
ETH/USDT 24-hour chart. Source: TradingView
If ETH could surpass the $3,340 range and bulls keep buying, ETH/USDT could rise to $4K. However, if the reverse is the case, the bears have resumed complete control, and ETH could decline using $2.4K as support.
ADA/USDT
$ADA is still struggling to break out of a critical resistance range. It has been bouncing around the $2.48 range despite hitting a peak price of $2.98 on August 23. However, the bounce in today’s session indicates that the market mood is still positive. But, the bulls would need to sustain the buying pressure for ADA to surpass its ATH, which is now acting as its next key resistance.
Once it surges past this resistance, its next resistance would be $3.55. The 20-day EMA pattern and the RSI gives an advantage to the bulls. However, if the bears should overpower the bulls, it would send the $ADA tumbling down towards the end of the 20-day EMA to initiate a new level of price correction.
BNB/USDT
BNB’s $517 price on May 19 remains its key resistance. Even though it rallied past this price a few days ago, the breakout was temporary and has since undergone a price correction. If the bulls can sustain the current buying pressure, BNB may overcome its next resistance until it reaches about $599, another crucial resistance.
Technical indicators (especially the 20-day EMA and the RSI) indicate that the bulls have the advantage. But if the bears take control from the bulls, it would lead to a BNB price decline towards the 200-day EMA. The general supply and demand in the market will eventually determine the price action of each crypto pairs.