
Key Insights:
- Ethereum’s daily close hits a three-month low, testing a critical 216-day support trend as the market watches for a potential downward shift.
- Technical patterns like falling wedges suggest possible bullish reversals, but resistance levels at $3,270 and $3,470 hold the key to trend continuation.
- Mixed signals from MACD and RSI indicators reflect uncertain market sentiment; upcoming days are crucial for determining Ethereum’s price trajectory.
The Ethereum market is facing a critical phase. Its price dropped to the lowest daily close since February, signaling potential vulnerabilities in its long-standing ascending support trend line. This trend line, a key marker of Ethereum’s price movement, has been a backbone of support since October 2023, underpinning a 170% rise in the cryptocurrency’s value. With Ethereum now teetering on this crucial support, the forthcoming days could be decisive in determining the future trajectory of its price.
According to CoinMarketCap data, on May 15, Ethereum recorded a daily close at $2,946, marking a downturn from its March high of $4,093. The loss of nearly 31% since the yearly peak exemplifies a stark reversal in momentum for the digital currency, which had seen robust growth in the months prior. The recent price actions put the 216-day support line at risk, with a potential breakdown suggesting a broader bearish trend might be settling in.
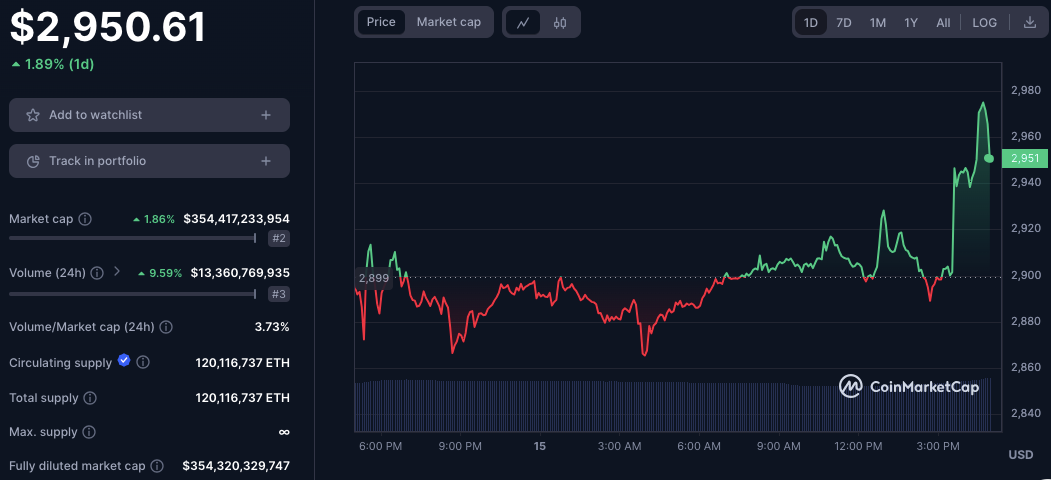
ETH/USD 1-day price chat (Source: CoinMarketCap)
Technical Patterns and Resistance Levels
Analyzing the chart patterns reveals intricate details about the possible movements of Ethereum’s price. A falling wedge pattern, identified from early March to mid-May, suggests a potential bullish reversal.
However, the effectiveness of this pattern is contingent on how the price interacts with existing resistance levels in the near term. These levels are identified at approximately $3,270 and $3,470, each representing crucial points that could either propel a bullish trend or reinforce bearish sentiments depending on how the price reacts.
Apart from the wedge, Ethereum’s price has also been navigating through rectangles labeled as ‘Bearish Target’ and ‘Bullish Target.’ These consolidation patterns indicate a pause in trend momentum, where the price stabilizes within a horizontal range before possibly continuing in the direction of the prior trend. The presence of these patterns underscores the ongoing uncertainty and volatility within the Ethereum market.
Indicators Reflect Mixed Market Sentiments
The use of technical indicators like MACD (Moving Average Convergence Divergence) and RSI (Relative Strength Index) provides further insights into the market’s mood. Currently, the MACD indicates a bearish phase, though a decreasing gap between the MACD and signal lines could hint at an upcoming bullish crossover.
Meanwhile, the RSI stands at around 42, below the neutral mark but above the oversold threshold, suggesting a slightly bearish momentum without significant oversold conditions.

ETH/USD 1-day price chat (Source: TradingView)
Volume trends also play a crucial role in assessing market dynamics. Observations show volume spikes correlating with major price movements. An increase in trading volume alongside price hikes could validate a bullish outlook, whereas high volumes during price declines suggest escalating selling pressure.
Critical Period Ahead for Ethereum’s Market Position
As Ethereum navigates through a complex array of technical signals and market sentiments, the next week could prove pivotal. The price is currently testing a 20-day moving average from below, which could act as a resistance barrier. A decisive move above this average might shift the market sentiment from bearish to bullish, offering a glimmer of hope for investors looking for a reversal in the current trend.
Furthermore, the upcoming days will crucially test Ethereum’s ability to maintain its long-term ascending support line. A daily close above critical resistance points, such as the $2,950 area, could favor a bullish scenario. Conversely, a closure below this support line would affirm the bearish control over the market, potentially ushering in a deeper correction phase.