
Key Insights:
- RNDR experiences a significant price surge, propelling it to the top ranks of cryptocurrency market capitalizations.
- Despite a temporary setback, investor activity and trading volume remain high, indicating the potential for a rebound.
- Technical analysis suggests a negative trend in the short term but leaves room for a bullish comeback.
RenderToken (RNDR) has witnessed a remarkable surge in its price, soaring by a staggering 63% over the last 12 days. This outstanding achievement has propelled RNDR to firmly establish its position at number 45 among the leading cryptocurrency market capitalizations.
In the preceding 24-hour period, the upward surge persisted, propelling the value of RNDR to reach its peak for the week at $2.79. Nonetheless, this upward climb faced formidable opposition, resulting in a momentary setback. Consequently, a 6.50% decline unfolded, with RNDR’s price plummeting to $2.48 at the present moment.
Despite the adjustment, investor engagement remained strong, showcasing their active involvement in the market. The market capitalization witnessed a slight decrease of 2.53%, settling at $932,291,586. However, there was a remarkable surge of 20.90% in the 24-hour trading volume, amounting to $251,299,671. This significant rise in trading activity indicates investors’ optimism and enthusiasm as they anticipate a possible recovery.
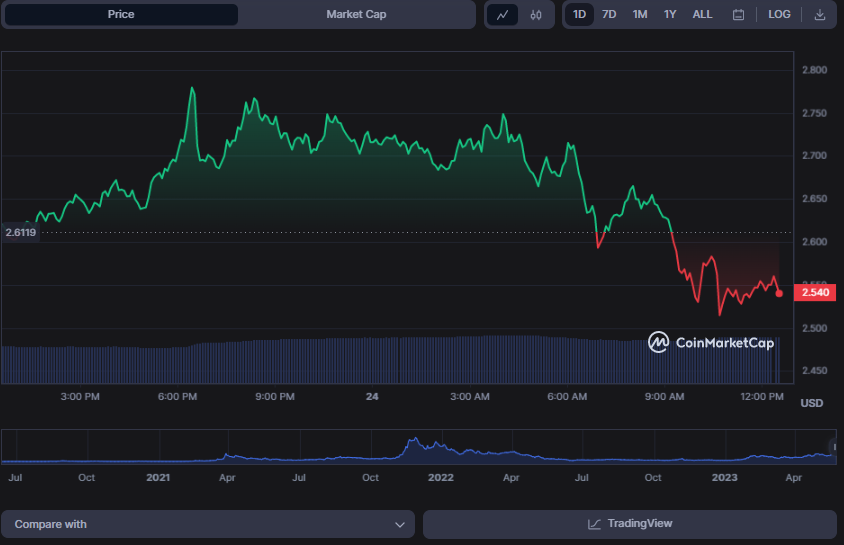
RNDR/USD 24-hour price chart (source: CoinMarketCap)
RNDR/USD Technical Analysis
The MACD line has gone below its signal line, with a value of 0.0825127, signalling profit-taking in the RNDRUSD market. This and the histogram movement in the negative zone suggest that bears have taken control of the market.
The Money Flow Index rating of 55.57 suggests some buying demand in the market, but more is needed to overcome the unfavourable attitude. Profitable traders may consider placing sell orders at crucial resistance levels. If the MFI goes below 50, it might indicate a shift towards selling pressure and a potential drop.
The RNDR market’s negative trend may continue in the short term, with a rate of change 4.20. This expectation stems from the RNDR price chart’s ROC level, which suggests bearish momentum. However, there is hope for a bullish comeback shortly since it is still in positive territory.
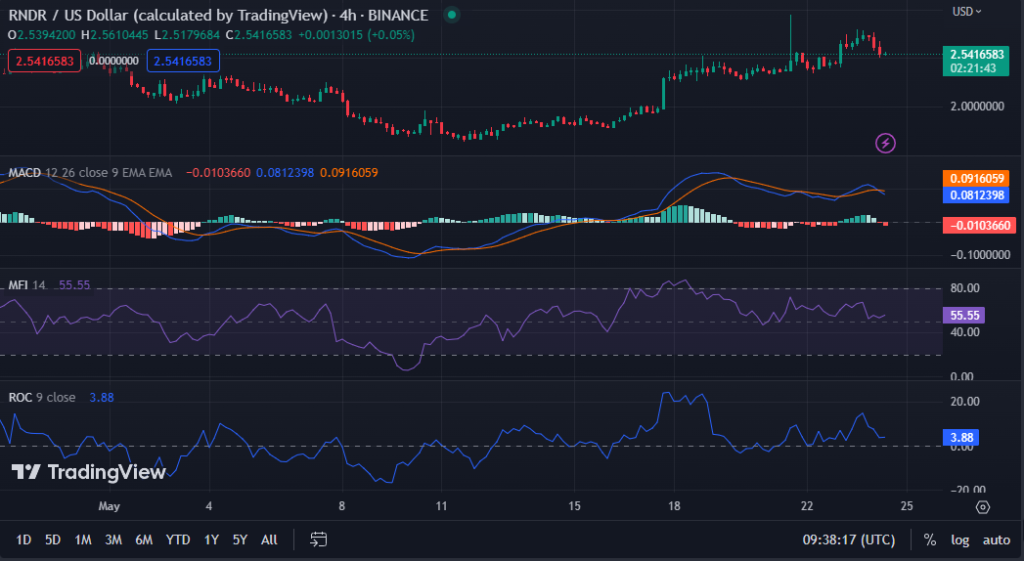
RNDR/USD 4-hour price chart (source: TradingView)
Conclusion
In summary, the remarkable surge in RNDR’s value encounters momentary barriers, yet the level of investor engagement and trading volume continues to soar, indicating the possibility of a resurgence.