
While MATIC started the new month on a strong bullish mood, the bullishness is gradually waning down. This current consolidation phase might cause MATIC to retest crucial resistance levels. On the other hand, the SHIB price has been declining since January 22. Even though most altcoins are already recovering, SHIB’s recovery hasn’t been as quick as the other altcoins.
MATIC Price Analysis On The 4-Hour Timeframe
MATIC price has been testing the $1.45 price level repeatedly. An uptrend could happen once MATIC flips this resistance as support. Nevertheless, traders can anticipate a 16% rise in MATIC price, corresponding to the $1.76 level. MATIC could test the $1.96 level (which corresponds to its week-on-week resistance).
A test of the $1.96 level would mean a profit of upto 28% gains from its current price. Scalp traders can make an entry at its current price of $1.50 and anticipate a $1.45 support level test. Long-term traders can also make an entry position as the polygon native token would likely make a reversal at the $1.44 level until it retests the $1.75 to $1.95 level.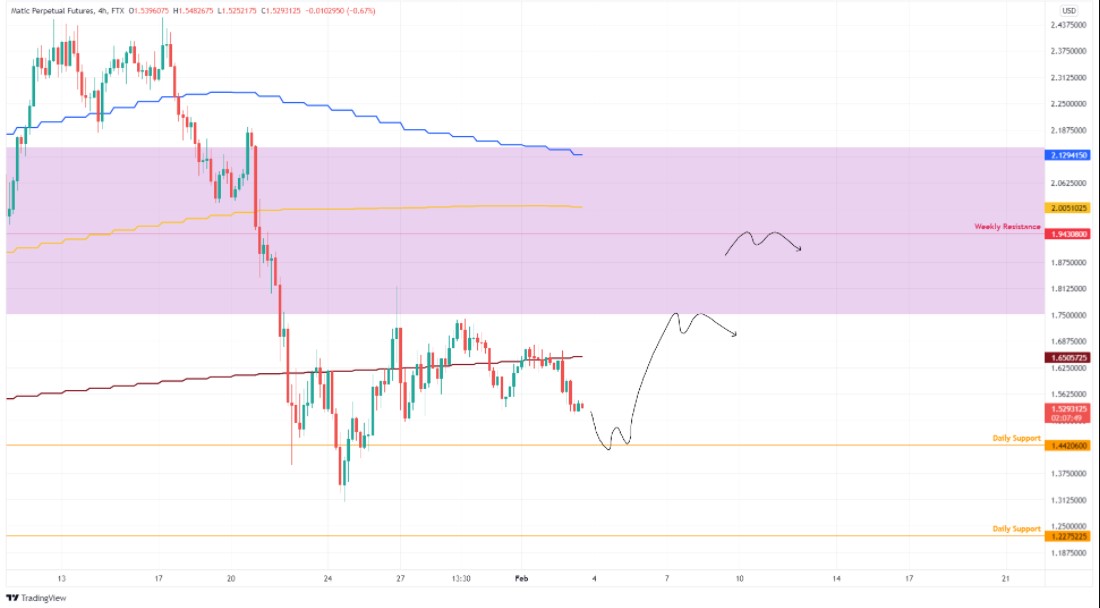
MATIC price action on the 4-hour chart. Source: Tradingview
While MATIC price action suggests a cause for optimism, a factor can nullify the bullish predictions. That factor is a close below the $1.42 level on the 4-hour candlestick. This close will establish a lower low, triggering the stop loss for most trades. Hence, intense selling pressure could result in a 14% decline in MATIC price, corresponding to the $1.24 support level.
SHIB Price Tending Towards The Daily Demand Zone
SHIB price crashed by 37% 12 days ago, which moved the meme token towards the 24-hour demand zone (which ranged between $0.0000159 and $0.0000206). While SHIB has made some slight recovery, it isn’t making moves that suggest it will soon break out of this zone.
However, once SHIB breaks out, value investors can expect to make up to 22% gains before the price hits the crucial long-term resistance of $0.0000255, which corresponds to the 200-day EMA. If the buying momentum is sustained at the $0.0000255 level, SHIB could make a move for the level corresponding with the 50-day EMA ($0.0000284). Thus, bringing total profits to 37%.
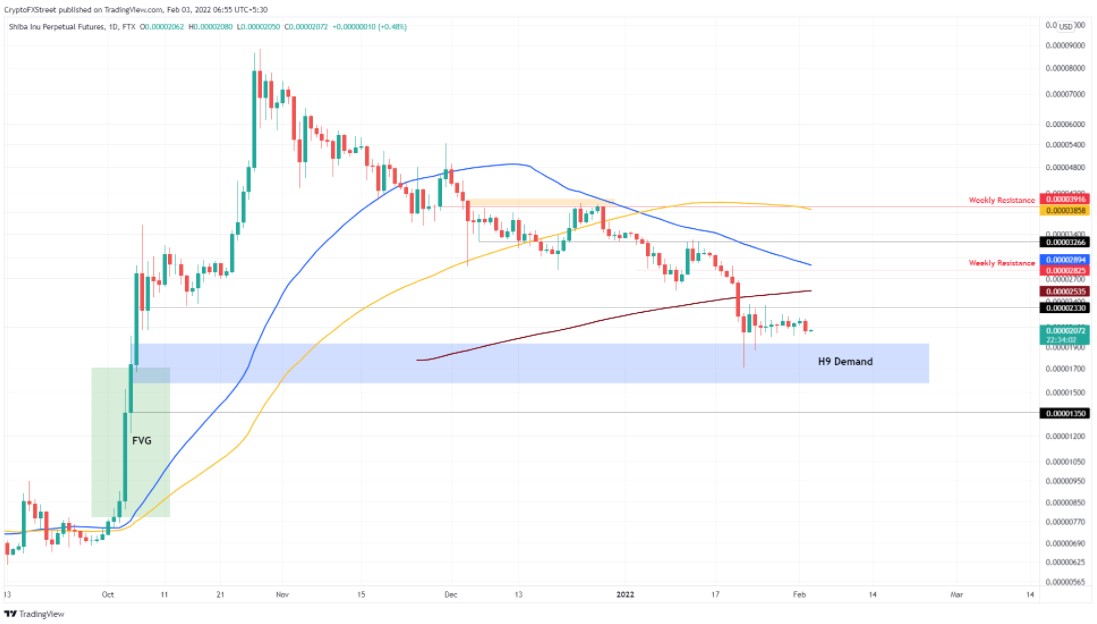
SHIB price action on the daily chart. Source: Tradingview
Bullish SHIB
Even though the technical indicators are bullish about SHIB, a downtrend could result in SHIB re-entering the daily demand zone. While this zone presents a chance for value investors to make their entry positions, SHIB might remain in this zone if the buying pressure isn’t sufficient enough.
If this happens, a close beneath the $0.0000159 level is inevitable with the creation of a lower low which will put the bears in control. A further downtrend can occur at this point which might push SHIB towards the $0.0000136 support, where a trend reversal that will kick-start a bullish run can happen. As of this writing, SHIB trades at about $0.0000203.