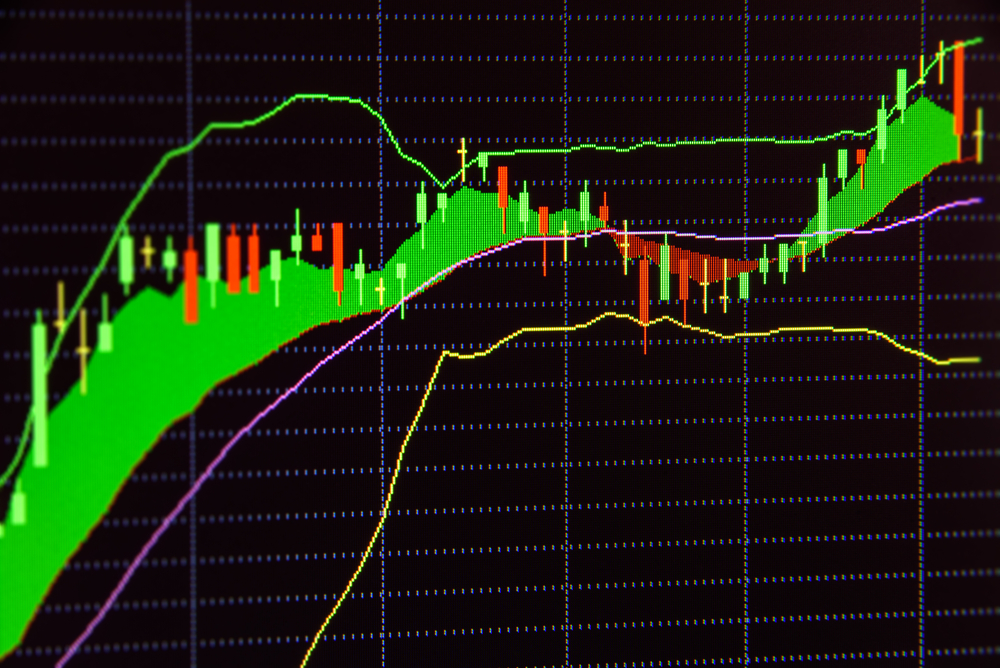
The ability to interpret the Bollinger Bands indicator is crucial for day or swing traders. In this guide, we will teach you how to use this indicator to identify profitable opportunities in the crypto market.
What’s Bollinger Bands?
Simply put, it s a tool that helps traders conduct proper technical analysis. They usually use it to track the future price movement of a particular crypto asset based on volatility. Created by John Bollinger, the Bollinger Bands indicator has three lines or bands: one on the upper side, the second in the middle and the third on the lower side. The indicator has been in existence since the 1980s.
Understanding the Three Bands
The upper band serves as a resistance line. So, in case a digital asset’s price reaches this level, it could suggest a reversal. On the other hand, the lower band acts as a support line. If a digital currency’s price crosses this line, then the traders assume the asset has been oversold, so they begin buying. The middle band or line is the 20-Day SMA (Simple Moving Average).
What are the Trading strategies for Bolinger Bands?
Although Bollinger Bands can be used along with other indicators, it’s also effective as a standalone trading tool, allowing traders to identify price trends, volatility, and potential reversals. Here are the strategies to consider when trading crypto using Bollinger Bands:
Bollinger Bounce
Traders using this strategy usually watch how an asset will react when it reaches the upper or the lower band. If it bounces off the upper band, traders expect a price drop, so they start selling. On the contrary, if the price of the cryptocurrency hits the lower band and reverses, traders anticipate a price surge. Therefore they take buy orders.
SMA-Led Bollinger Bands
As mentioned before, the middle band serves as the 20-day SMA. It can help you to identify market trends. Here is how: Any price above the band signals an uptrend, while prices below it suggest a potential downtrend. Therefore, it is possible to enter the market by simply analyzing the prices using the middle line.
Bollinger Squeeze
This strategy involves traders checking any deep squeeze of the lower and upper bands. When one of the two bands squeezes, it signals low volatility and that the market is preparing for a massive breakout. However, the downside is that the Bollinger Bands do not tell the direction of the incoming breakout. Therefore, in this case, you can integrate other indicators.
How Do You Use Bollinger Bands in Cryptocurrency Trading?
As stated earlier, the Bollinger Bands indicator is ideal for swing or day trading. Traders involved in this type of trading always monitor the lower and upper bands. If they are expanding, the traders assume the market is trending in a particular direction. In such an event, they check for price surges and corrections using the Bolinger Bounce strategy.
Conversely, if one of the outer bands is squeezing, it suggests consolidation, which could lead to a breakout. But as we have said, traders need another indicator to determine the direction of the breakout.
Using Bollinger Bands Alongside Other Indicators
Here are the indicators you can use along with Bollinger Bands.
MACD and Bollinger Bands
The MACD indicator gives you an extra confirmation for a trading signal. For instance, when the upper Bollinger band squeezes and the MACD line crosses below the signal line, it suggests a breakout on the downside or a short-term price drop.
Relative Strength Index (RSI) and Bollinger Bands
You can use both Bollinger Bands and RSI to confirm if an asset has actually reached the oversold or overbought region. Here is how: For example, if the cryptocurrency’s price hits the upper hand and the RSI is above 70%, then you can conclude that the digital asset has entered the overbought zone, and a price reversal is likely. On the other hand, if the price touches the lower band and the RSI is below 40, the asset is considered to be in the oversold zone. Therefore, traders expect a rebound.
