
Like other digital assets, ETH has also been declining since early November, when it set a new peak price of $4.87K. The decline was further confirmed when it broke its next crucial support to resistance. This dipping move resulted in establishing a local of $2.16K last week. A bounce off this low confirmed the $2.35K level as support.
Ethereum started the first day of the second month on a positive note, gaining nearly 3.9% to trade at $2.81K as of this writing. ETH/USD has surged past its local high of $2.7K and looks set to establish a new higher high.
ETH 24-Hour Price Action
ETH has demonstrated huge volatility over the past 24 hours, trading between $2.49K and $2.62K. Its trading volume of nearly $12B indicates a rise of 19%. The RSI on this timeframe has surged back to 44, indicating bullishness.
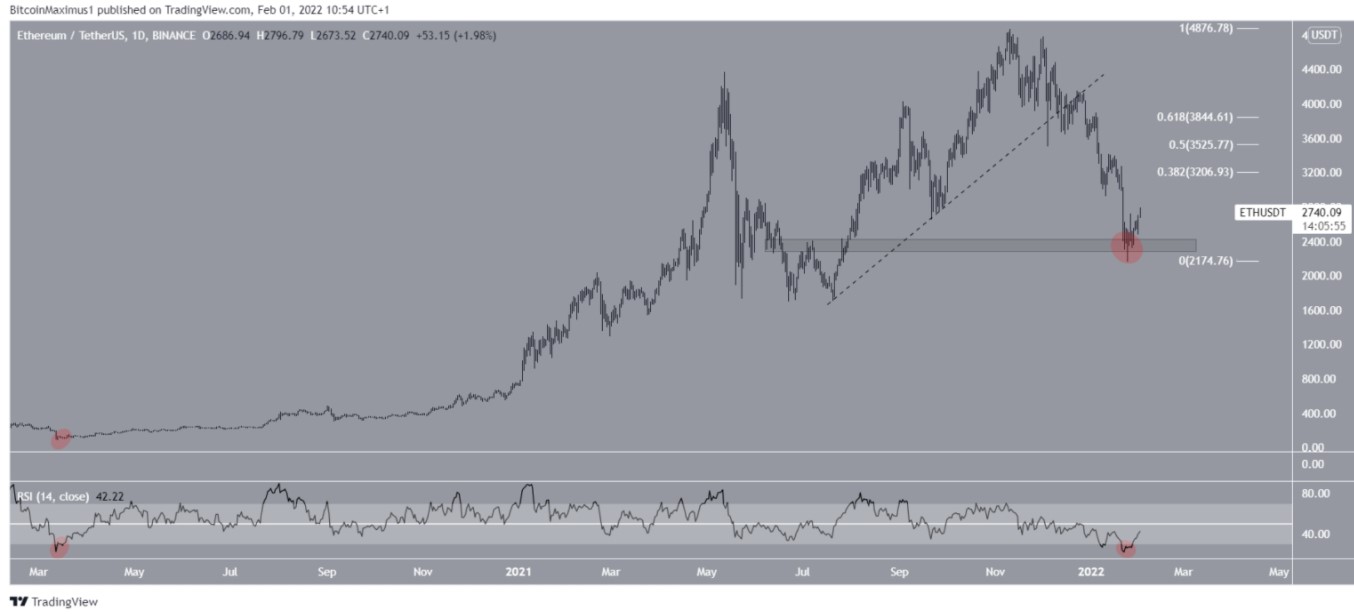
ETH price movement on the 24-hour chart. Source: TradingView
It dipped into the oversold territory at less than 30 shortly before the surge. If the bulls can sustain this bullish momentum, ETH’s next resistance would be at the $3.22K level, corresponding to the 38.3% Fib retracement level.
ETH Price Action On The 4-Hour Chart
ETH is also bullish on the 4-hour chart and might even set a new higher high before the end of the next trading session. ETH started its bullish movement last Thursday. It traded around the $2.3K and $2.7K levels between last Thursday and yesterday.
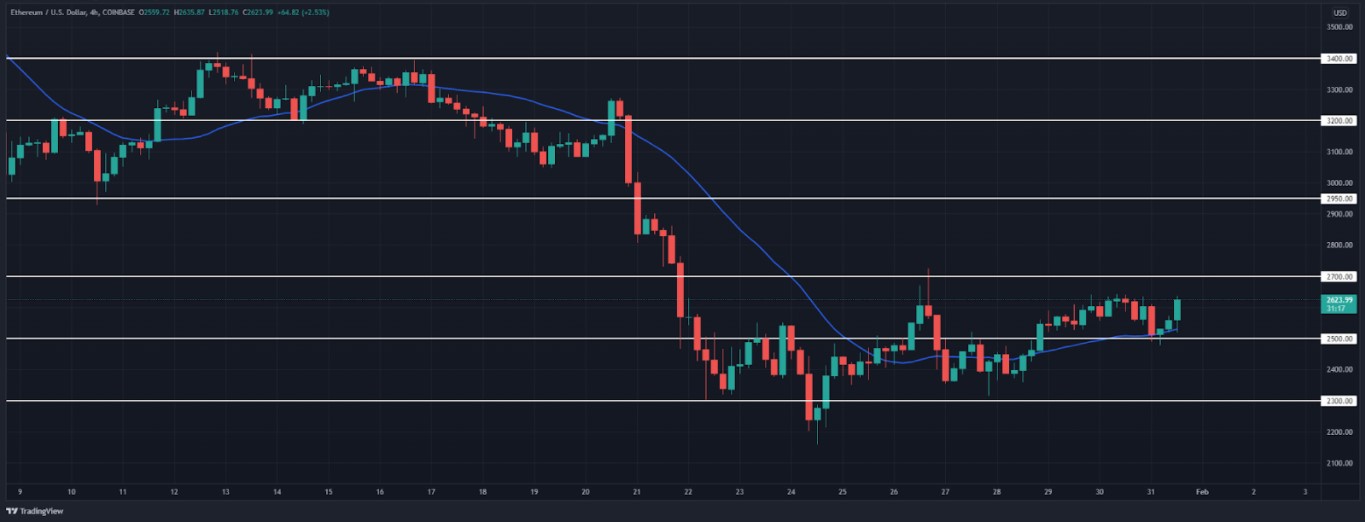
ETH price movement on the 4-hour chart. Source: TradingView
ETH hasn’t traded below that price level after flipping the $2.5K as support over the weekend. ETH/USD has established a higher low as it has remained bullish in the last 24 hours.
A confirmation of this bullishness would see ETH establishing a new higher high soonest. ETH price is bullish today, especially as it moves higher from the $2.5K level after flipping it as support. Its next local resistance would be the $2.98K level. If it surges past this level, it would have established another higher high.
Another Downtrend Is Likely – Analyst
Famous crypto trader on Twitter with the username (@tradinghub) opined that the ETH price correction isn’t over yet. He further claimed that ETH price would need to make another downtrend action before its price correction is completed.
After the May 2021 peak, the ETH price action modeled an A-B-C structure’s shape, with the A and C having equal symmetry. But it’s yet to complete the structure. Also, this A-B-C corrective movement has occurred within an ascending parallel channel, which is further proof that another downtrend might happen.
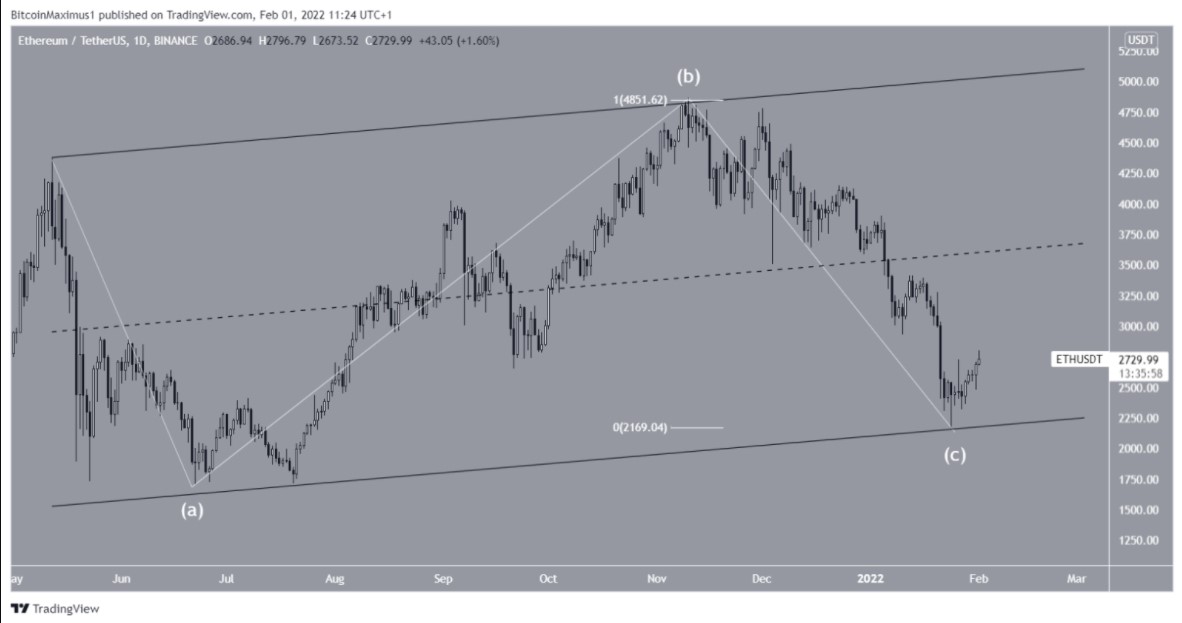
ETH’s A-B-C corrective structure. Source: TradingView
An additional proof that another downward move is likely is that the second leading cryptocurrency hasn’t yet completed its five waves based on the short-term wave count. However, @tradinghub predicts that ETH will reach the $3.15K level before the subsequent downward movement will happen soon. The 2-hour chart shows a 3-wave structure which further validates @tradinghub’s analysis and prediction as discussed above.