DOT price is on an uptrend which might extend further to test its next crucial resistance. Investors who make the right call can seize the chance to earn decent profits from this temporary uptrend.
Likewise, SOL price has spiked significantly over the last day as it trades at $110.02 as of this writing. While the price has been declining in the previous 48 hours, the bulls’ intense buying pressure is now impacting the SOL price positively. It won’t be a surprise if the price reaches $115 in the next few hours.
DOT Price Rising Gradually
DOT has been on an uptrend after suffering from a January 24 flash crash, creating three higher highs and higher lows, respectively. The latest higher low is crucial as it sets up DOT for a bullish move to surge past the $21.5 critical resistance. This resistance level coincides with the week-on-week supply region, extending between $22.34 and $28.48.
Thus, it may take longer than expected for DOT to flip this resistance to support. Therefore, investors should expect DOT to remain range-bound near this level for some time. Scalpers can make a buy entry position at DOT’s current price of $19.41 to earn profits at $21. If the bulls can sustain the buying pressure, DOT’s rally might extend to the $24.19 price level, corresponding to the 50-day ema for a total profit of 25%.
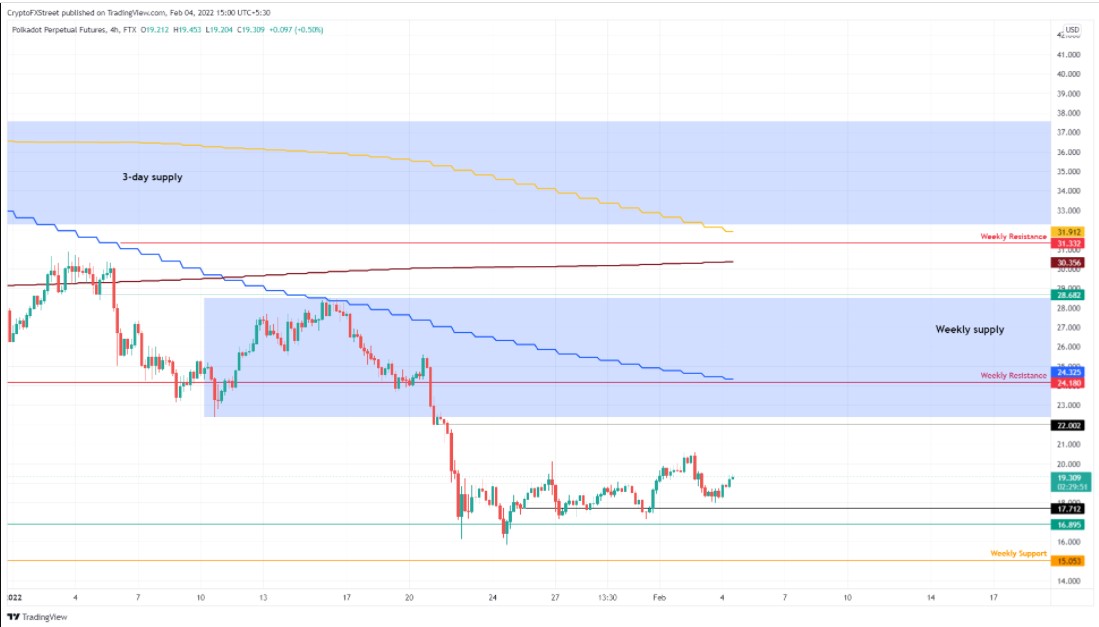
DOT price action on the 4-hour chart. Source: Tradingview
However, this bullish analysis may become invalid if the DOT candlestick on the 4-hour chart closes less than the $16.88 support level. Should that happen, buyers’ confidence will decrease and allow the bears to control the DOT market fully. Consequently, the DOT price may retrace towards the $15.07 support level.
SOL May Test The $115 Local Resistance Level
The daily timeframe suggests that the SOL price will remain bullish throughout today. SOL price is $110.05 as of this writing representing gains of 14.05% in the past 24 hours. Its week-on-week performance also surged by nearly 20%, even though it suffered a major retracement two days ago.
Even though its market cap surged by 9.5%, its trading volume dipped by nearly 20%. Thus, making its market dominance about 1.95%. A confirmation of the SOL bullish bias is the near intersection between the 20-day and 50-day EMA curves. Also, there have been changes to the limits on the Bollinger bands.
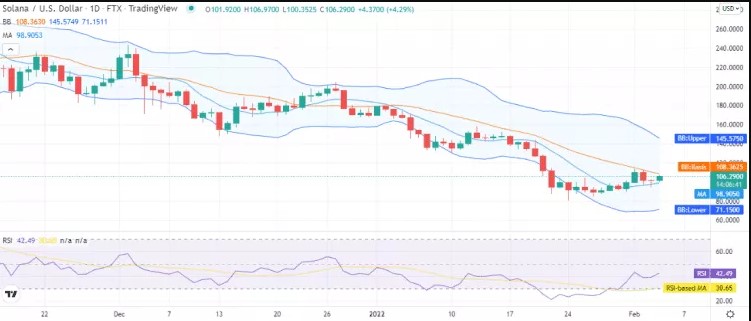
SOL price on the daily chart. Source: Tradingview
As of this writing, the bands’ upper and lower limits, which represent SOL’s resistance and support, are $146 and $72, respectively. The RSI, which has increased to 43, further confirms the bullish analysis.
The 4-hour chart confirms that bulls fully control SOL’s price trend. The only difference is that the SMA on this chart hasn’t increased to reflect the bullishness. The volatility has been huge over the past 15 hours. Thus, suggesting fast price changes. The RSI has also been rising and is now 56 as the buying pressure intensifies.