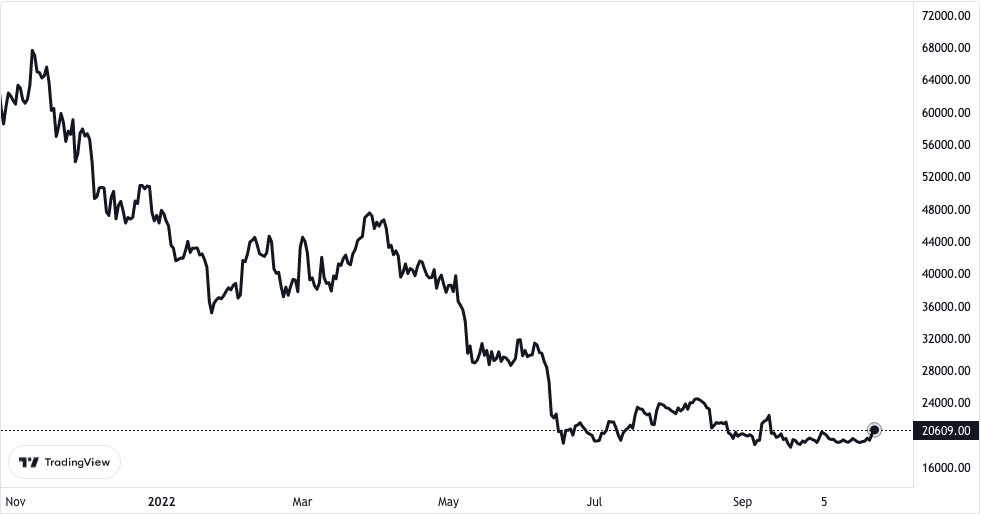
Bitcoin price has begun what seems to be a strong rally over $19,650. The market’s leading asset currently trades above $20,609 and might gain more momentum.
Bitcoin Shows Strong Hand
Bitcoin began to show a strong hand above the $19,500 resistance line. The asset is currently trading above $20,000 and its100-hour simple moving average. There is equally a major contracting triangle coming together with the resistance on the hourly chart.

BTC/USD price chart. Source TradingView
The BTC/USD pair began another decisive increase since it moved above $20,500. Bitcoin’s price has been well-bid recently since it crossed the $19,000 line. It was able to create a base over the $19,650 resistance area and sprang up from there.
It rose by more than 5% and advanced clearly above the $20,000 line. While the increase was on, a move was observed above the linking bearish trend line. Was, at that time, forming with some level of resistance close to $19,300 on the BTC/USD hourly chart.
Bitcoin currently trades considerably high above $20,000 and its 100-hour simple moving average. A new high has been created at $20,400. The asset’s price is currently consolidating its gains.
However, there was a little drop under the 23.6 Fibonacci retracement area of the increase. It came from the $19,266 downtick to the $20,400 high. On the upper side, however, the immediate point of resistance is close to $20,300.
Other Possibilities
There is equally a major contracting triangle being created with a resistance close to $20,300. It also appears on the BTC/USD price chart.
The asset’s first major point of resistance was close to $20,400 and $20,500 but it beat them both. Now that it has successfully risen above the $20,500 mark, the next level to reach is $21,200. Further gains beyond that point would see Bitcoin racing toward $22,000.
But if Bitcoin fails to clear the $21,200 zone, it might then begin a downward correction. The first point of support it would reach is at $20,200.
After that, the next significant level of support for Bitcoin would be met at $19,800. It is close to the 50% Fibonacci retracement area of the latest rise. It came all the way from a $19,266 downward swing and a $20,400 upward swing.
Another downward movement and further close under $19,800 could lead to more losses. It could open the floodgate for a renewed testing of the $19,500 support level.
