After a bearish January, ALGO price is rising gradually. Even though it remains range-bound around its next crucial resistance, it might likely break out of it soon as it continues to test that resistance level (the $1 level) especially in the last week. Meanwhile, Decentraland’s native token (MANA) is about to embark on a strong bullish run after flipping a crucial resistance to support.
ALGO Price Is Ready For A Breakout
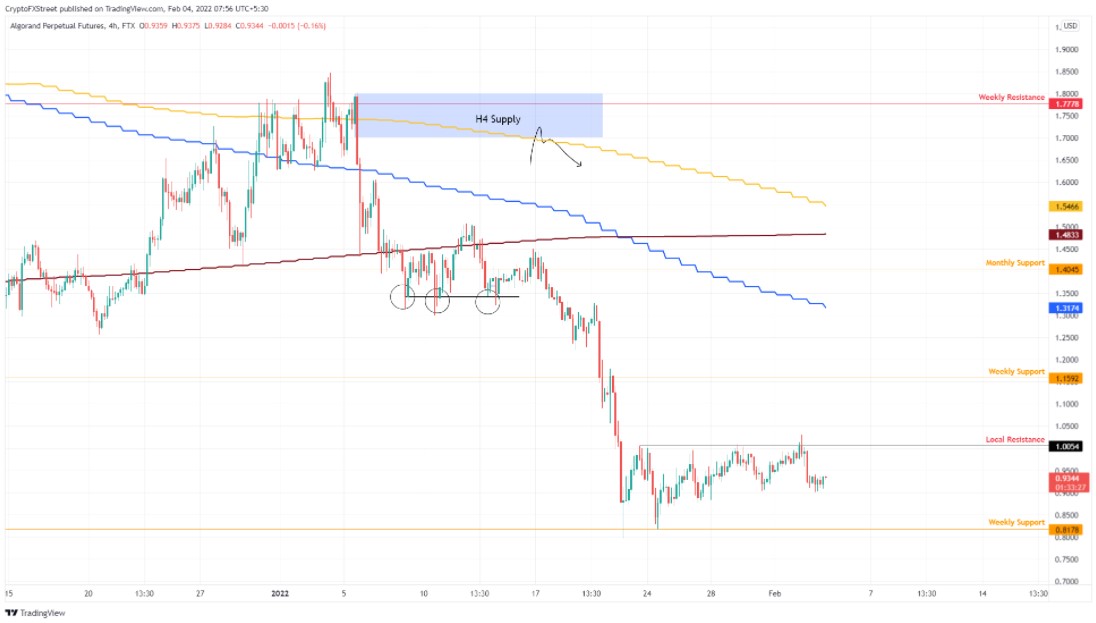
Since the current crypto market bias is positive, a breakout should be on the horizon as the bulls intensify their buying pressure. The first proof of a breakout will be a close over the $1 barrier on the 4-hour chart. The technical indicators suggest that ALGO price may rise up to $1.17, which would represent a 25% increase from its current price of $0.926.
It is highly likely that Algorand price will experience a strong rejection at levels higher than the $1.17 price. But intense buying pressure by the bulls could push ALGO to flip this resistance into support. If that happens, traders’ profits could rise up to 45% as ALGO seeks to test the $1.318 price corresponding to the 55-day EMA.

ALGO price 4-hour chart. Source: Tradingview
Conversely, if the bears should seize control, ALGO price might create a lower low as it would have created a candlestick close below the $0.819 level on the 4-hour chart. Additional intense selling pressure would put the bears in full control and nullify the bullish analysis. Consequently, ALGO price could decline by up to 19% which would be close to the $0.676 support.
MANA Price Is On A Resurgence
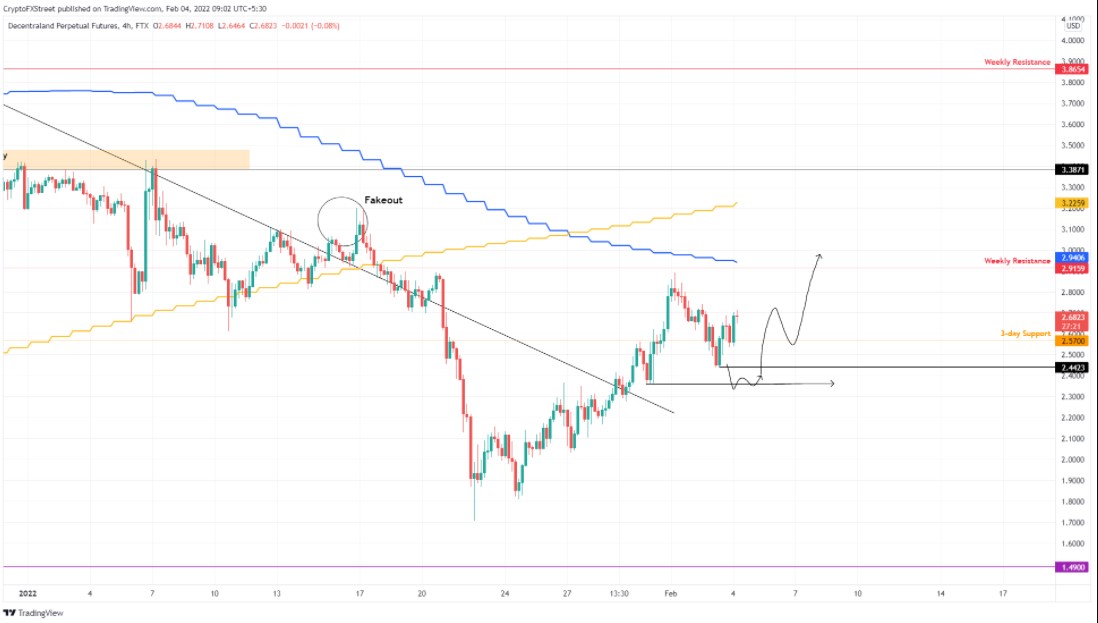
After establishing two higher highs around the $3 mark three days ago and ten days prior, MANA price suffered a significant downturn. However, MANA is showing a strong recovery from this loss. Already, it has flipped the $2.56 resistance to support, indicating the possible start of a strong bullish move.
Hence, it should be no wonder when MANA skips past the local resistance of $3. This price level represents the intersection between the 50-day EMA and week-on-week local resistance. MANA could well test the $3.24 levels (corresponding to the 100-day EMA) if the bulls can retain control. Thus, total profits from this strong bullish move could reach 21%.

MANA price 4-hour chart. Source: Tradingview
An indicator supporting MANA’s bullishness is IntoTheBlock’s GIOM analytics app. The app reveals that nearly 30K addresses holding nearly 300m MANA tokens are likely to start exiting their trades at the $3.11 level. Another proof of this bullish prediction is the decreasing MANA tokens on exchanges. Approximately 8m MANA tokens have exited the exchanges which shows investors’ confidence in MANA’s price action.
While there are optimism surrounding MANA’s price action, an unfavorable market bias might cause MANA price to move on a downtrend with the $2.58 price level acting as the first crucial support. Furthermore, if the candlestick should close below the $2.43 level, it will result in a lower low and cancel out the bullish optimism.
