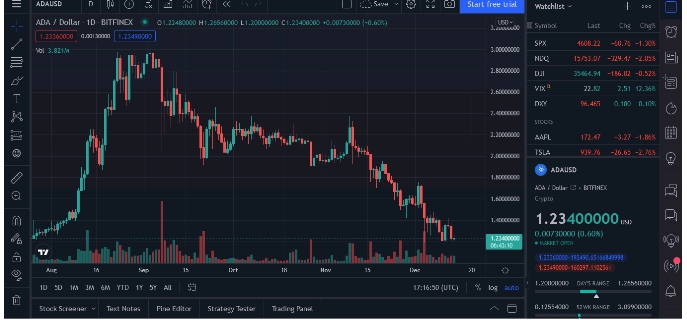
The plan of the Federal Reserve to regulate the crypto market is the primary big deal that may likely affect the uptrend of digital assets. Cardano is packing heat on the market with all indications set up for an uptrend. Analysts say the crypto has formed a reversal pattern, a sign that the digital asset is entering a bull season.
ADA Rebound Likely
Technical analysts describe the forming pattern as “triple bottom”. The expression means the behavior of an asset after a downtrend occurs. The markers are three subsequent dipping points that are scattered on a level. By implication, the pronged low points mean sellers cannot smash a specific support level. The failure to break this point does not happen once but thrice. Once the failed breakpoint occurs, the market signals for buyers. By implication, the market enters a bull season.
In theory, buyers coming to purchase a coin force the instrument to move sharply higher. This behavior is referred to as the “neckline”, which combines the highest points of the earlier two rebounds. The pattern does not end there, and the lines result in a positive surge, where the price goes much more elevated, doubling the gap between the base and neckline.
Presently, the price of ADA reflects the triple bottom, although not completely. The pattern indicates a rebound just after the third low barely formed.
Accumulation Forming
Trading volume slightly rose, resulting from the price reversal of ADA. The rise in trading volume shows that buyers supported the temporary uptrend. Analysts believe that ADA will move towards $1.40, equivalent to a 30% rise. If prices continue to smash the neckline point, it means that the token will rally towards $1.63.
Cardano’s price action did not indicate ending in a triple bottom. The turning point was when ADA suffered a 60% plunge from ATH it recorded back on September 2. The reversal pattern resulted from the poor run of ADA, which recorded a 45.50% loss in a market where Ether pulled in 15% profit.

ADA/USD Source:Trading view.com
Buyers also contributed to a significant ADA selloff, thereby pushing the RSI of the asset into oversold. The resultant price drop caused an obnoxious trend called “accumulation area”. Relative strength index and the accumulation pattern formed in the market for this coin added to the pronged nature of the chart.
ADA recorded a significant dip up to 5.50% in the last 24 hours. This downtrend affected other crypto assets in the market. Bitcoin took a 3% dip, and Ether suffered a 5% plunge within the same time frame. Amidst the downtrend digital assets are experiencing now, the Federal Reserve in the United States will enact its asset-purchasing policy. This policy underlies the uptrend that the stock market and crypto had witnessed, which started back in March 2020.
Sentimental And Psychological Risks
The regulators will also discuss increasing rates next year, resulting in an unpredictable impact on the market. Bitcoin and altcoins have enjoyed massive rallies since last year and early this year, resulting from cheap lending policies.
ADA continues to move towards $1.18 as the regulators plan to implement their policies. The current price charge of ADA had earlier been its testing support the past week. Breaking the support line means a price rebound in the fray for ADA holders and backers. The $1.18 line sits on 0.618 Fib line, which implies an accurate Fibonacci retracement graph to predict support and resistance level for ADA.
Analysts say that ADA may test $1 as psychological support resulting in an early upturn, just like its several rebounds in February and July.
