While the overall SHIB price analysis shows bearishness, there is a slight uptrend in SHIB price. Like the broader crypto market, SHIB has been on a downtrend over the past 48 hours. It declined from $0.00002748 on February 21 to its current price of $0.00002414.
On Tuesday, SHIB has been experiencing huge volatility, which has caused a slight surge in its price. SHIB has declined by 7.40% in the last 24 hours, with its trading volume now at $1.89B, while its overall evaluation now stands at nearly $13.5B. It is currently ranked 14th among all other cryptocurrencies.
SHIB’s Price Action On The 4-Hour Chart
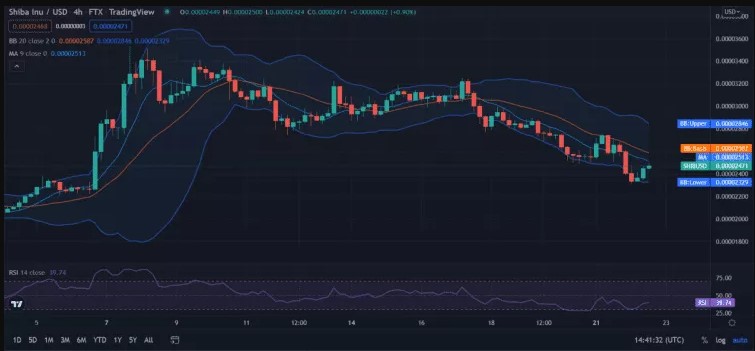
The analysis of the 4-hour chart indicates a decline in market volatility and a bearish SHIB price action. Thus, resulting in a close-up between the resistance and support. SHIB price will remain in a narrow range until there is massive volatility in the market. The upper and lower limit of the Bollinger band acts as resistance and support levels for SHIB. These limits correspond to the $0.00002847 and $0.00002330 price levels.
The SHIB price cuts beneath the 100-day MA curve on this chart confirm the bearishness. However, this bearish move creates an opportunity for a renewed bullish action. A reversal in the market trend will see the SHIB price line cut above the 100-day MA and make a sustained uptrend move. SHIB’s RSI score of 39 indicates that the digital asset is grossly undervalued. But, an uptrend movement indicates a dominant buyer action.

SHIB price action on the 4-hour chart. Source: TradingView
SHIB’s Price Action On The Daily Chart
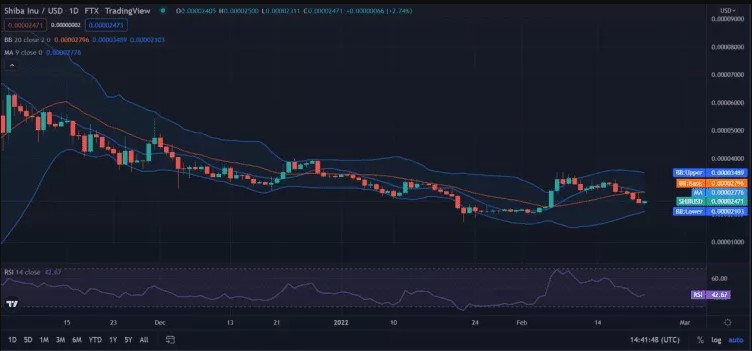
While SHIB price action indicates bearishness, it is becoming less susceptible to volatility effects as the market volatility gradually winds down to exhaustion. As in the 4-hour chart, the upper and lower limit of the Bollinger band acts as SHIB’s strongest resistance and support levels, respectively. These levels correspond to $0.00003490 and $0.00002104, respectively.
Also, the SHIB price line cuts under the 100-day ma on this chart and further confirms the bearish price action. However, the price remains on a downtrend with possibilities of further decline.

SHIB price action on the 24-hour chart. Source: TradingView
An RSI score of 42 on this daily chart indicates stability for the SHIB price. Despite an indication of price stability, a slight uptrend in price action will show intense buying pressure and an increase in RSI score. While the sellers currently control the SHIB market, the bulls aren’t relenting in their buying efforts to rescue control from the sellers. If the intense buying efforts continue, they might resume the market’s control within the next 24 hours.
Top Indian Crypto Exchange Enables SHIB Transactions
Today, the top Indian crypto exchange, ZebPay, revealed that its users can now make SHIB transactions on its recently launched QuickTrade app, and they won’t charge any fees for such transactions. One major attraction is that users can fill their requests without delay through this new app. SHIB transaction is the latest addition to the app’s feature as it only enabled BTC, ETH, and MATIC transactions on the launch date.
